← Back to Portfolio

Ecommerce Sales Dashboard
The Challenge
Ecommerce businesses track revenue across channels, products, and customer segments - but most teams rely on spreadsheets or basic analytics tools that don't give a unified view. They need a dashboard that answers: how are we performing this month vs last? Which customers drive the most revenue? Where should we focus?
The Solution
A 3-page interactive Power BI report built on a proper star schema, with 27 production-ready DAX measures covering every standard KPI pattern.
Report Pages
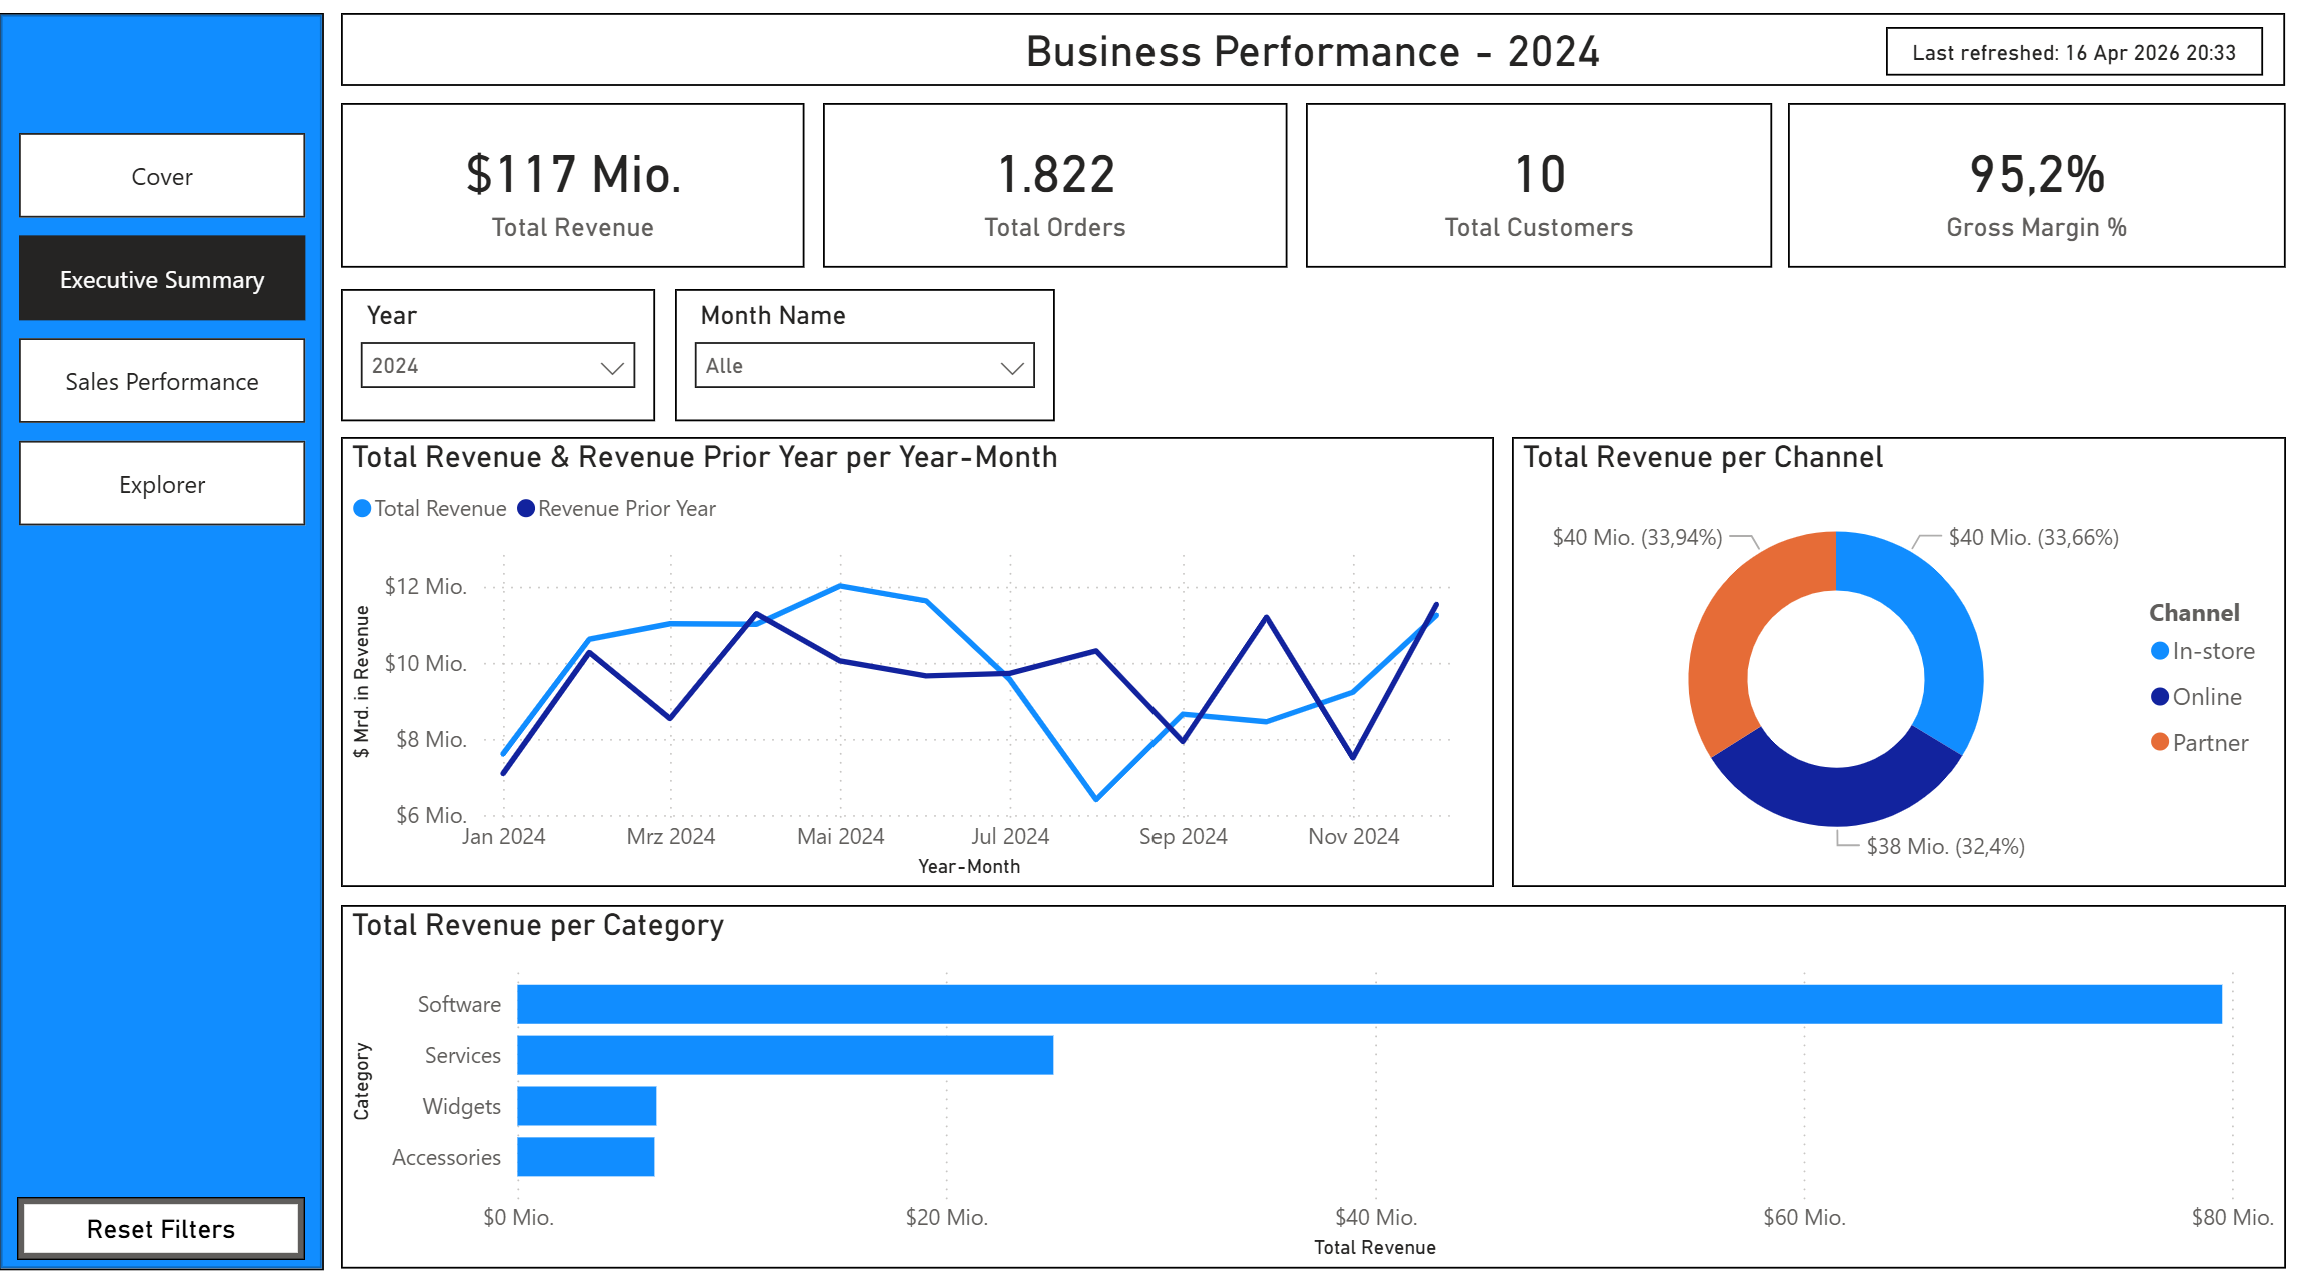
- Executive Summary - year-level KPIs (revenue, orders, customers, margin), revenue trend with prior year comparison, channel and category breakdown
- Sales Performance - MoM and YoY growth with conditional formatting (green/red), monthly revenue trend vs prior year, top 10 customers, product performance matrix
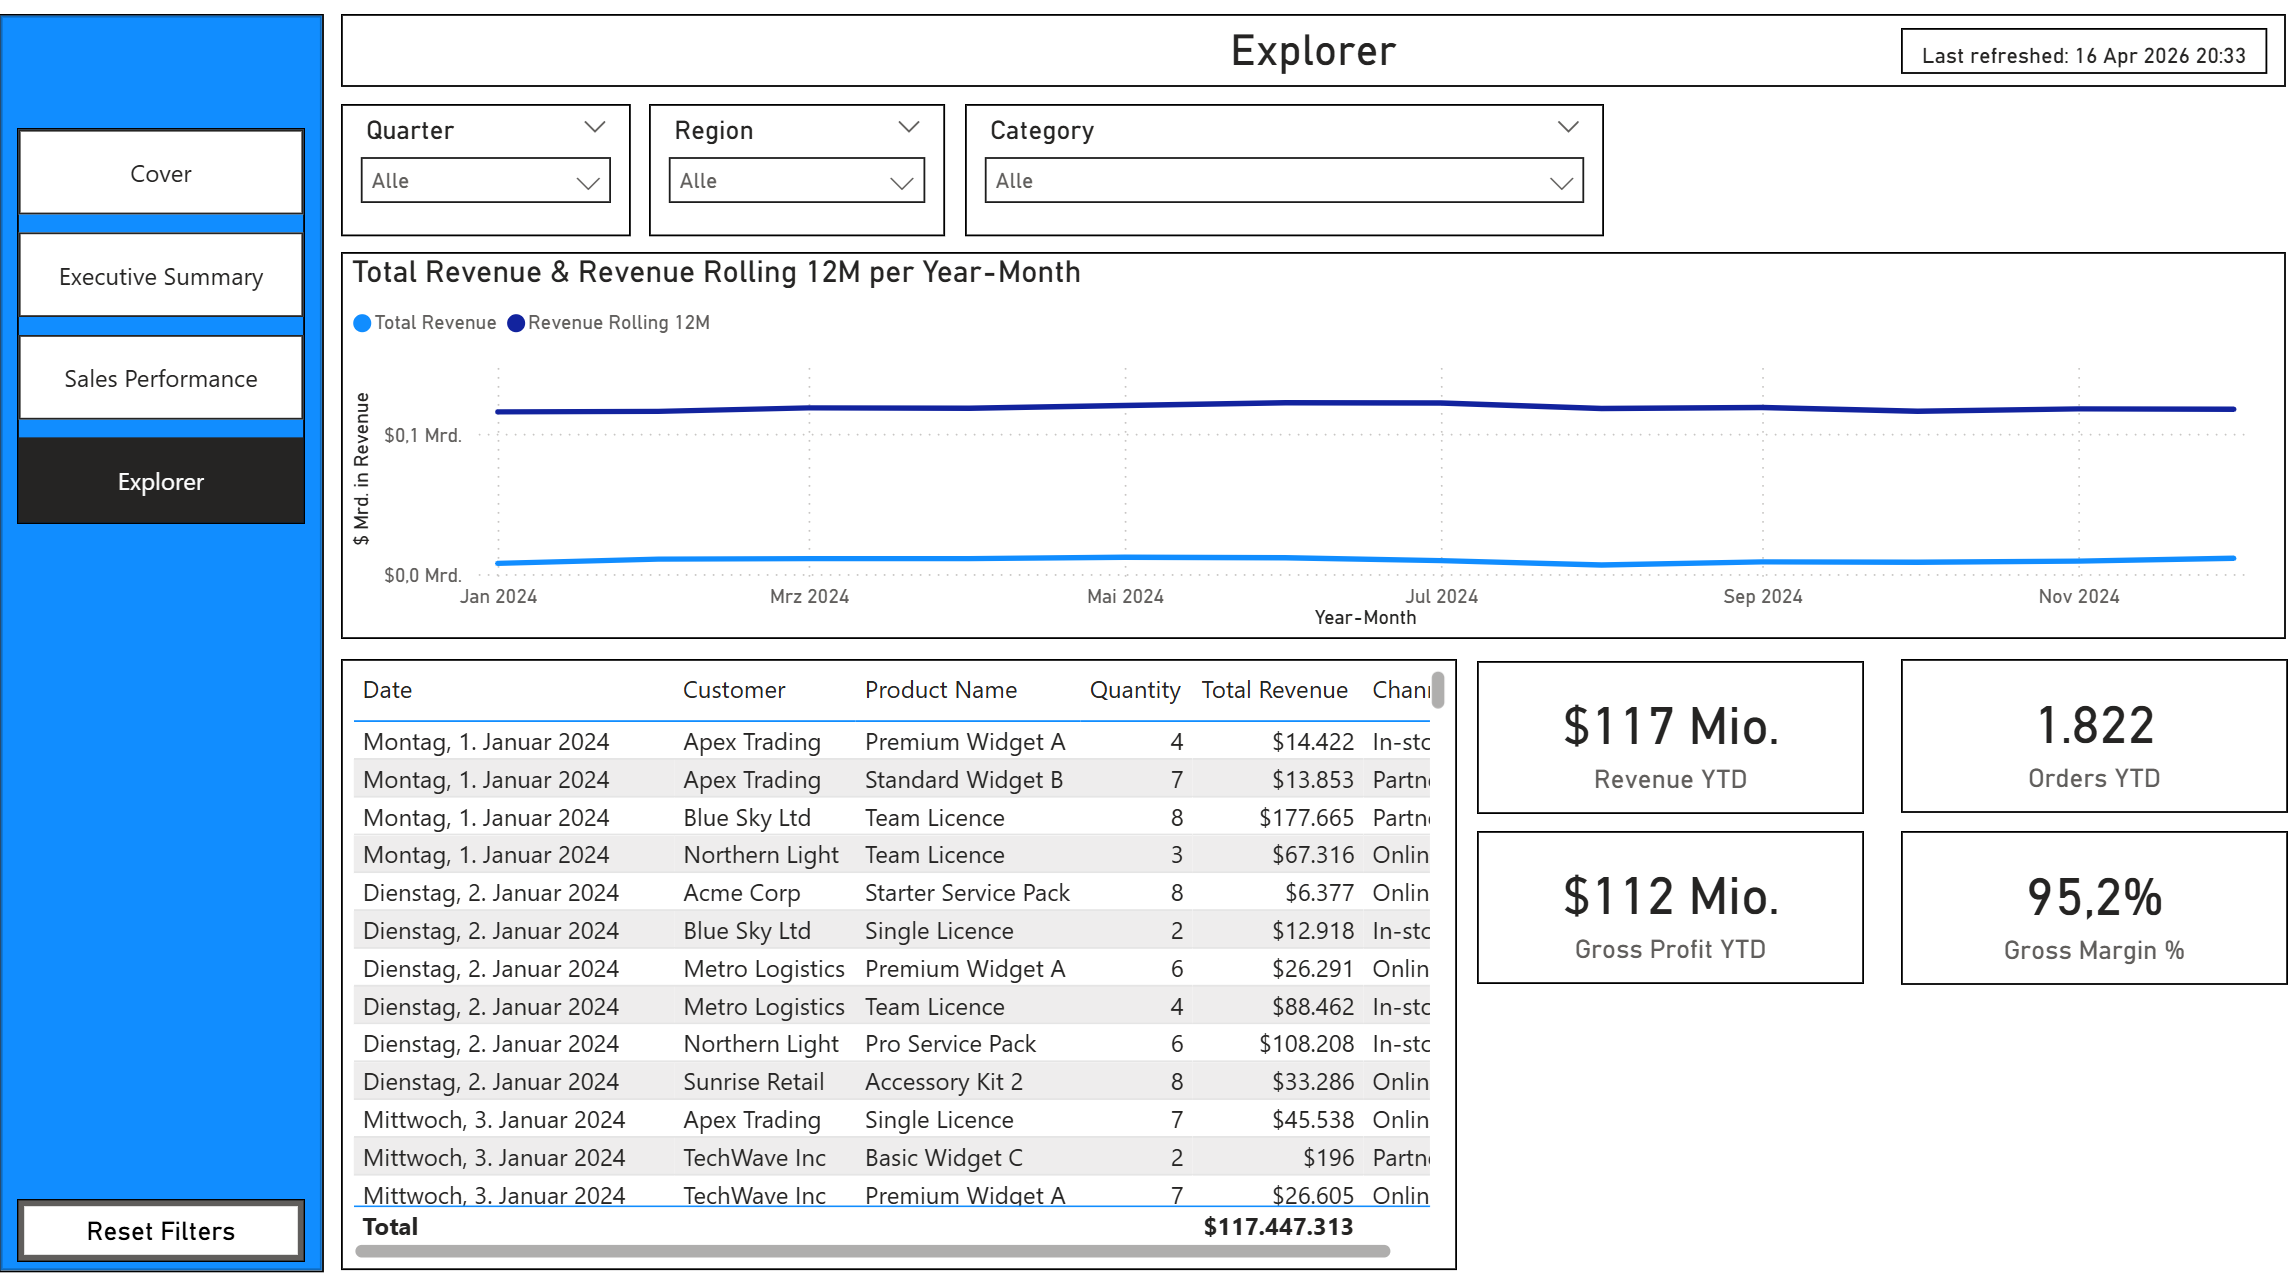
- Explorer - free-form analysis with 5 slicers, rolling 12-month trend, order detail table, YTD KPIs
Data Model
- Star schema - fct_sales surrounded by dim_customer, dim_product, dim_date
- Date table - properly marked, spanning 2022-2026 with all date attributes
- Relationships - many-to-one, single direction, all active
- Measure table - all 27 measures organized in a dedicated Sales Measures table
DAX Measures
27 measures covering:
- Base metrics: Total Revenue, Orders, Customers, COGS, Gross Profit, Margin%, AOV
- Time intelligence: YTD, Prior Month, Prior Year, MoM%, YoY%, YoY Variance
- Rolling periods: Rolling 12M, Rolling 3M
- Ranking: Customer Rank, Product Rank, Revenue Cumulative % (Pareto)
- UX: Dynamic page titles, conditional colour measures, Last Refreshed timestamp
Features
- Left navigation pane on every page
- Synced slicers across all pages
- Conditional formatting on MoM/YoY KPI cards
- Custom tooltip pages (hover for customer/product detail)
- Reset Filters button
- Row-level security (sample "Region - North" role)
- Branded cover page with navigation button
- DIN font throughout
Deliverables
- .pbip project (PBIR + TMDL format, version-controllable)
- Sample CSV data (3,600+ rows)
- Setup guide with column mapping and troubleshooting
- Data dictionary documenting every measure